Open Source Alternatives
  • Alternatives
  • Categories
    Categories by size882 projects
    • Developer Tools461
    • AI & Machine Learning404
    • Web Development196
    • Business & Productivity191
    • Communication & Collaboration126
    • Security & Monitoring126
    • IT Management123
    • Product & Project Management106
    • Cloud & Hosting105
    • Data & Analytics104
    Browse all 21 categoriesLLMOps & AI Tooling, Design & Creative and 9 more
  • Blog
  • Advertise
SearchNotion, Slack, password manager.../
Submit
Open Source Alternatives
  • Alternatives
    • Developer Tools461
    • AI & Machine Learning404
    • Web Development196
    • Business & Productivity191
    • Communication & Collaboration126
    • Security & Monitoring126
    • Browse all 21 categories
  • Blog
  • Advertise
Submit your project

New open source projects by email

The projects we add and every new guide. Free, unsubscribe any time.

Open Source Alternatives LogoOpen Source Alternatives

Handpicked Open Source Alternatives to Paid Softwares

Product

  • Categories
  • Tag
  • Advertise

Resources

  • Blog
  • Collection
  • Submit

Company

  • Privacy Policy
  • Terms of Service
  • Refund Policy
  • Sitemap

Alternatives

  • Claude Code
  • Jira
  • Notion
  • Slack
  • Linear
  • Wispr Flow
  • All alternatives
© 2026 Open Source Alternatives. All rights reserved.
Open SourceAlternatives
Home/Categories/Security & Monitoring/Prometheus
icon of Prometheus

Prometheus

Open source alternative to Datadog, Dynatrace, Grafana Cloud and New Relic

  • 66.7K stars
  • Apache-2.0
  • Active this week
  • Last commit 1 day ago

Last verified Oct 20, 2026

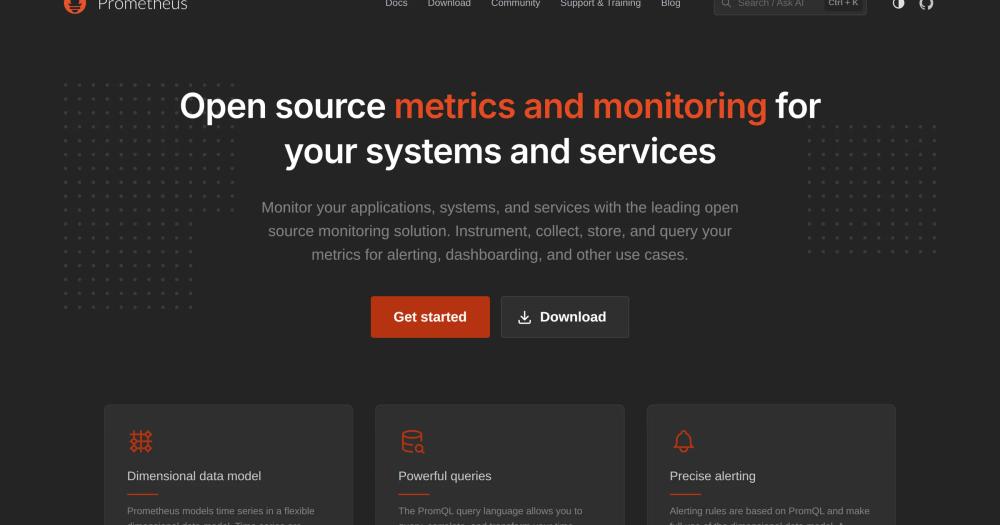
Prometheus is an open-source monitoring solution with a dimensional data model and powerful query language for time series data.

Visit websiteGitHub66.7K stars1-click deploy on Hostinger
image of Prometheus
TL;DR

Prometheus is a self-hosted metrics platform for teams replacing Datadog-style monitoring with pull-based collection, PromQL, and alerts, giving full control over telemetry data and observability costs.

Read the full breakdownHide the full breakdownWho it is for, how it works, trade-offs, the quick start and the FAQ
who it's for

Who Prometheus is for#

SRE teams monitoring production services

Track request latency, error rate, saturation, and service health with PromQL queries and alerting rules that match each team's reliability targets.

Skip if:

Skip if the team needs logs, traces, and metrics in one managed product from day one.

Platform engineers running Kubernetes clusters

Use service discovery, labels, exporters, and dashboards to monitor changing workloads without manually registering every target.

Skip if:

Skip if the team cannot own metric naming, scrape configs, and retention settings.

Infrastructure teams reducing observability spend

Run metrics collection and alerting on owned infrastructure instead of paying usage-based SaaS rates for every host, service, and time series.

Skip if:

Skip if internal operations time costs more than the managed monitoring bill.

Developers instrumenting custom applications

Expose application metrics through Prometheus client libraries, then query and alert on application-specific behavior without waiting for a vendor integration.

Skip if:

Skip if the application already emits only vendor-specific telemetry and migration is not planned.

the problem

The problem it solves#

Managed monitoring platforms become expensive as services, labels, retention, and alert volume grow. Platform teams also lose direct control over scrape strategy, storage policy, and where operational telemetry lives. Prometheus gives those teams a self-hosted metrics system that runs close to their infrastructure and keeps collection, querying, and alerting under their control.

how Prometheus solves it

How it solves it#

Pull-based metric collection

Prometheus scrapes configured HTTP endpoints on a schedule, so teams control exactly which targets emit metrics and how often data is collected. Static configs and service discovery both work for changing infrastructure.

PromQL time-series queries

PromQL lets teams aggregate, filter, and calculate over metric labels for latency, error rate, saturation, and capacity questions. Queries can drive dashboards, alerts, and recording rules.

Dimensional data model

Metrics use names plus key-value labels, which makes it practical to slice data by service, instance, job, environment, or cluster without creating separate metric families for every view.

Rules and alert routing

Prometheus evaluates recording and alerting rules locally, then can route firing alerts through Alertmanager for grouping, deduplication, and notification workflows.

Exporter and client library ecosystem

Teams can instrument applications with client libraries or collect metrics from existing systems through exporters for services such as databases, hosts, proxies, and container platforms.

strengths · trade-offs

Strengths and trade-offs#

Strengths

  • Control over telemetry ownershipPrometheus runs on your infrastructure, so teams define retention, access, scrape targets, and alert logic without sending core operational metrics through a proprietary telemetry plane.
  • Reliable during infrastructure failureEach Prometheus server is autonomous and does not depend on distributed storage by default, which makes it useful during outages when other shared infrastructure may be degraded.
  • Strong cloud-native fitThe pull model, service discovery support, labels, exporters, and PromQL all map well to dynamic service-oriented infrastructure and Kubernetes-style workloads.
  • Apache 2.0 licenseThe Apache 2.0 license allows commercial use, modification, and redistribution, which fits teams that need an open monitoring stack with clear enterprise licensing terms.

Trade-offs

  • -Metrics-first scopePrometheus focuses on numeric time-series metrics. Teams that need logs, traces, session replay, or all-in-one incident workflows usually pair it with other observability tools.
  • -Cardinality needs disciplineUnbounded labels can create too many time series and pressure storage or query performance. Teams need metric naming and label rules before large production rollout.
  • -Not for exact billing dataPrometheus favors reliable operational monitoring, not perfect per-request accounting. The official docs advise against using it when 100 percent accuracy is required for use cases such as billing.
versus alternatives

Prometheus vs alternatives#

Prometheus vs Datadog

Prometheus and Datadog both help teams monitor infrastructure and applications, but they make opposite tradeoffs. Prometheus is an Apache 2.0 self-hosted metrics system: you own scrape configuration, storage, PromQL queries, and alert rules. Datadog is proprietary SaaS: it reduces setup work and combines metrics, logs, traces, dashboards, and managed integrations in one hosted product.

Choose Prometheus when data ownership, cost control, open standards, and custom metric design matter more than managed convenience. It fits SRE and platform teams that can operate their own monitoring stack and want telemetry close to their infrastructure. Choose Datadog when a team needs an all-in-one managed observability product with less internal operations work, especially if logs and traces must ship with metrics immediately.

install · quick start

Quick start#

bash
# Docker quick start from the official README
docker run --name prometheus -d -p 127.0.0.1:9090:9090 prom/prometheus

# Local binary flow from the official getting-started guide
tar xvfz prometheus-*.tar.gz
cd prometheus-*
./prometheus --config.file=prometheus.yml
tech stack · detected from GitHub

What it's built on#

Languages
GoTypeScript
Frameworks
React
frequently asked

FAQ#

Is Prometheus a Datadog replacement?

Prometheus can replace the metrics and alerting parts of Datadog for teams that want self-hosted control. It does not replace Datadog's full managed logs, traces, dashboards, and incident workflow package by itself.

Does Prometheus require Kubernetes?

No. Prometheus can monitor hosts, applications, and services outside Kubernetes. Kubernetes is a common fit because Prometheus handles dynamic targets and labeled time-series data well.

What is PromQL used for?

PromQL is the query language for selecting, filtering, aggregating, and calculating over Prometheus time-series data. Teams use it for dashboards, alerts, recording rules, and incident investigation.

Can Prometheus collect logs and traces?

Prometheus is built for numeric metrics, not log storage or distributed tracing. Teams commonly pair it with Grafana, Loki, Tempo, Jaeger, or another tool when they need those telemetry types.

What is the easiest way to try Prometheus?

The official README shows a Docker command that starts Prometheus on port 9090. The official getting-started guide also shows how to download a release, create a prometheus.yml file, and run the binary locally.

also worth a look

Similar open-source tools#

ClawTrace

Alternative toLangSmith

Visualize agent execution trees and track token costs per step

  • 47 GitHub stars
  • Apache-2.0Licence Apache-2.0

Stakpak

Alternative toDatadog

Open source agent that automates app deployment and monitoring

  • 1,813 GitHub stars
  • Apache-2.0Licence Apache-2.0

OpenObserve

Alternative toDatadog

Self-hosted observability for logs, metrics, and traces

  • 22,443 GitHub stars
  • AGPL-3.0Licence AGPL-3.0

Coroot

Alternative toDatadog

Instant observability with no-code setup.

  • 7,977 GitHub stars
  • Apache-2.0Licence Apache-2.0

Grafana

Alternative toDatadog

Open source dashboards for metrics, logs, and traces

  • 77,396 GitHub stars
  • AGPL-3.0Licence AGPL-3.0

VictoriaMetrics

Alternative toGrafana Cloud

High-performance self-hosted time series database and metrics

  • 17,887 GitHub stars
  • Apache-2.0Licence Apache-2.0
by category

Open source tools in these categories#

126

Security & Monitoring

REA (Reverse Engineer Anything), RustDesk, Uptime Kuma
87

DevOps & CI/CD

Nvm, Uptime Kuma, Netdata
104

Data & Analytics

Firecrawl, ragflow, Worldmonitor
Hostinger

Run Prometheus on your own server

Hostinger sets Prometheus up as a one-click app on a VPS.

Deploy on Hostinger

Featured

rakazo

Alternative toGrok Bot

AI teammates you own: your keys, your model, your machine.

  • 4,904 GitHub stars
  • Apache-2.0Licence Apache-2.0
  • #AI Agents

Omnara

Alternative toCClaude Managed Agents

Open-source agent deployment API. Self-host or use Omnara Cloud.

  • 2,957 GitHub stars
  • Apache-2.0Licence Apache-2.0
  • #AI Agents

Inbox Zero

Alternative toSuperhuman

AI email assistant that drafts replies and clears your inbox

  • 12,712 GitHub stars
  • AGPL-3.0Licence AGPL-3.0
  • #Email
Feature your project

New open source projects by email

The projects we add and every new guide. Free, unsubscribe any time.

Find open source alternatives to paid software

/
  • Claude Code to OpenCode
  • Jira to Windshift
  • Notion to AppFlowy
  • Slack to Mattermost
  • Linear to GitLab
  • Wispr Flow to Handy
  • CapCut to Concat
  • Grok Bot to rakazo
  • Superhuman to Inbox Zero
  • Airtable to AITable
  • Muse to OpenClaw
  • GitHub Copilot to Cline
  • Datadog to Netdata
  • Microsoft Teams to Rocket.Chat
  • Pinecone to Qdrant
  • Zapier to n8n
  • Devin AI to OpenHands
  • Firebase to Supabase
  • 1Password to KeePassXC
  • Confluence to Docmost
  • Contentful to Strapi
  • Adobe Premiere Pro to Shotcut
  • ChatGPT to AnythingLLM
  • LangSmith to Langfuse